
The $6T Rewrite
The real story isn’t that software is dying. It’s that AI isn’t competing for the $0.5 trillion software market.

Redpoint just released the most data-rich snapshot of AI-era SaaS disruption anyone has published. 53 slides. CIO surveys, public market decomposition, agent maturity modeling, startup economics. Most people will read the headlines (”SaaS is dead!”) and miss what the data actually says. The real story isn’t that software is dying. It’s that AI isn’t competing for the $0.5 trillion software market. It’s competing for the $6.1 trillion labor market. And the companies that survive are the ones that own proprietary data, regulatory infrastructure, and transaction embedding. The ones that die are the ones whose core value prop is coordination, because AI does coordination natively.
Let me walk through what the deck actually shows, and why it matters more than the panic.
The Infrastructure Is Real This Time
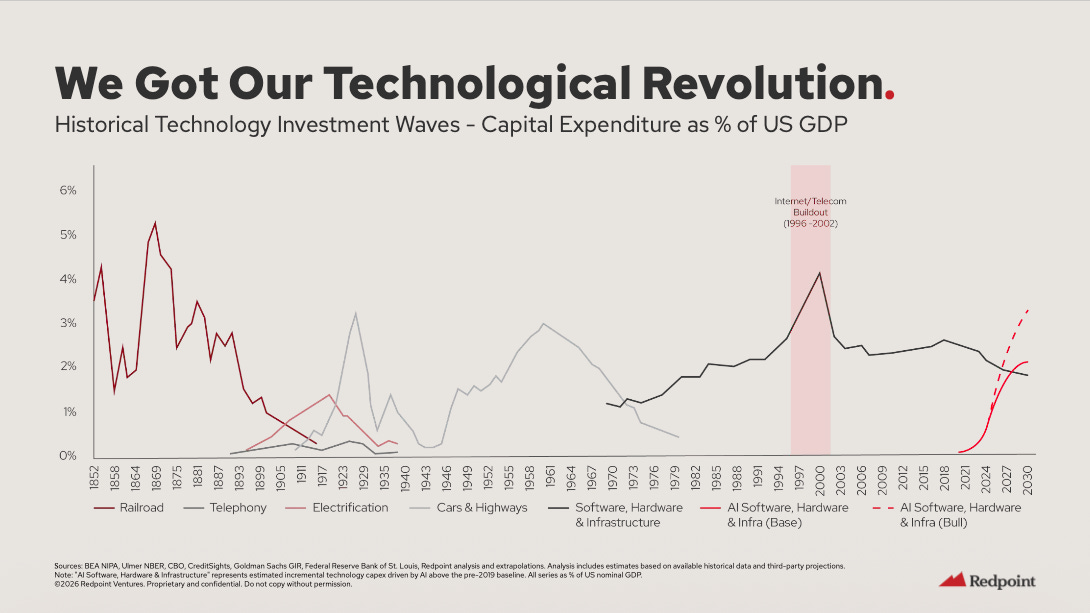
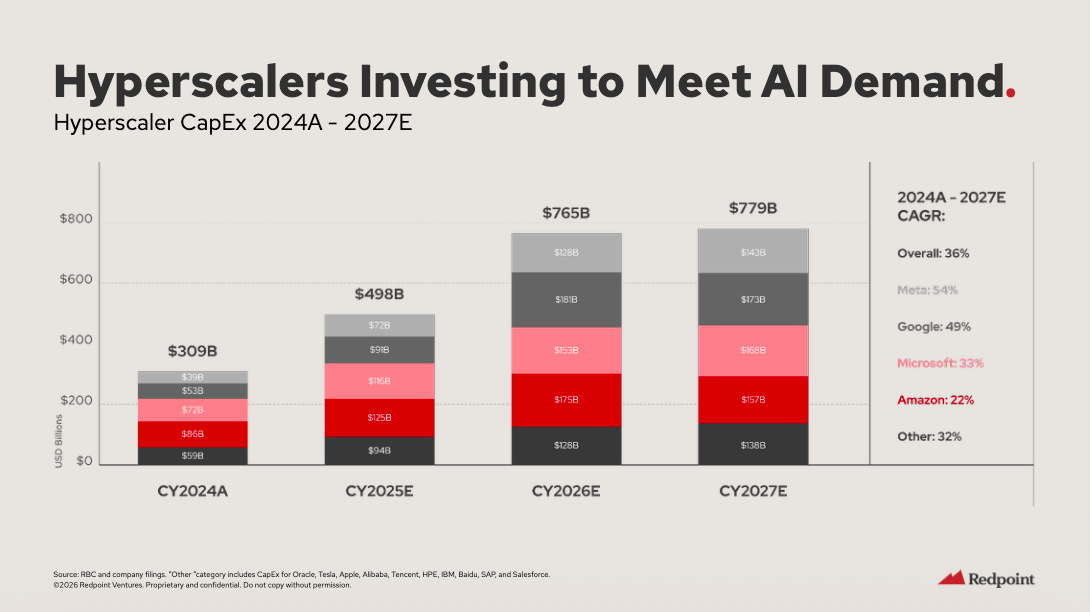
The first thing Redpoint establishes is that this isn’t the dotcom bubble. AI capex as a percentage of GDP is now a distinct investment wave, comparable to railroads, telephony, and the internet buildout (Slide 2). Hyperscaler CapEx is going from $309B in 2024 to $779B by 2027, a 36% CAGR (Slide 3). That’s real capital, not speculative fiber.
The part that kills the bubble narrative: OpenAI and Anthropic are each generating $20B+ in ARR. Over 90% of buildout capacity is pre-committed. Near-zero data center vacancy rates. 1B+ monthly active users four years post-ChatGPT (Slide 4). As Logan Bartlett, who co-wrote the deck, put it on LinkedIn: “The infrastructure isn’t running ahead of demand. Demand is pulling the infrastructure forward.”
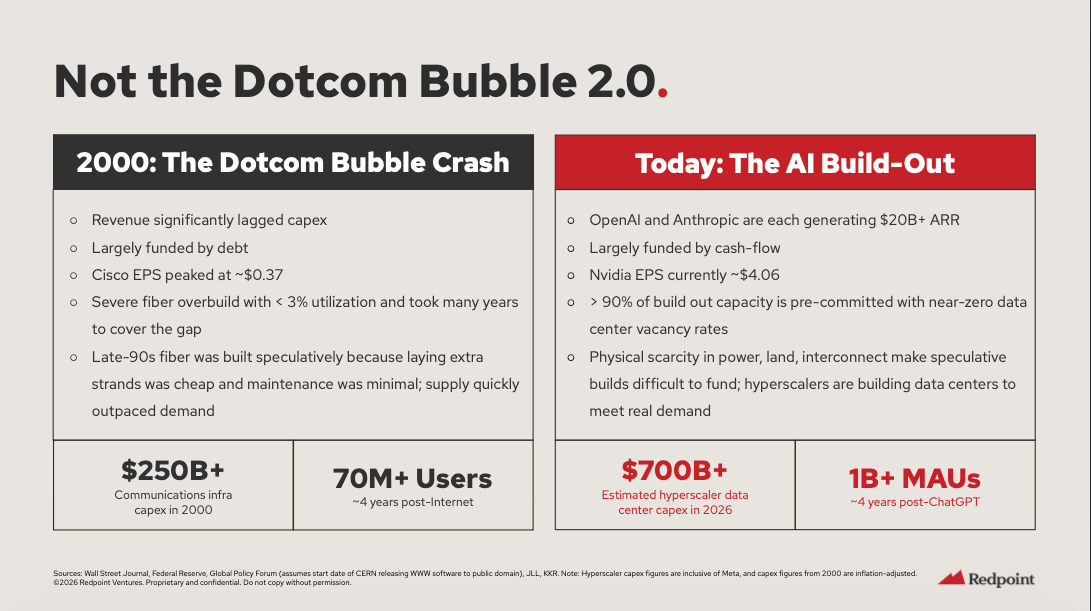
This is the opposite of 2000. In 2000, you had Cisco trading at $0.37 EPS while fiber sat at 3% utilization. Today, Nvidia is at $4.06 EPS and capacity is oversubscribed. That distinction matters because it tells you the correction in software stocks isn’t about the AI thesis being wrong. It’s about the AI thesis being right, and software being on the wrong side of it.
The Three-Layer Divergence
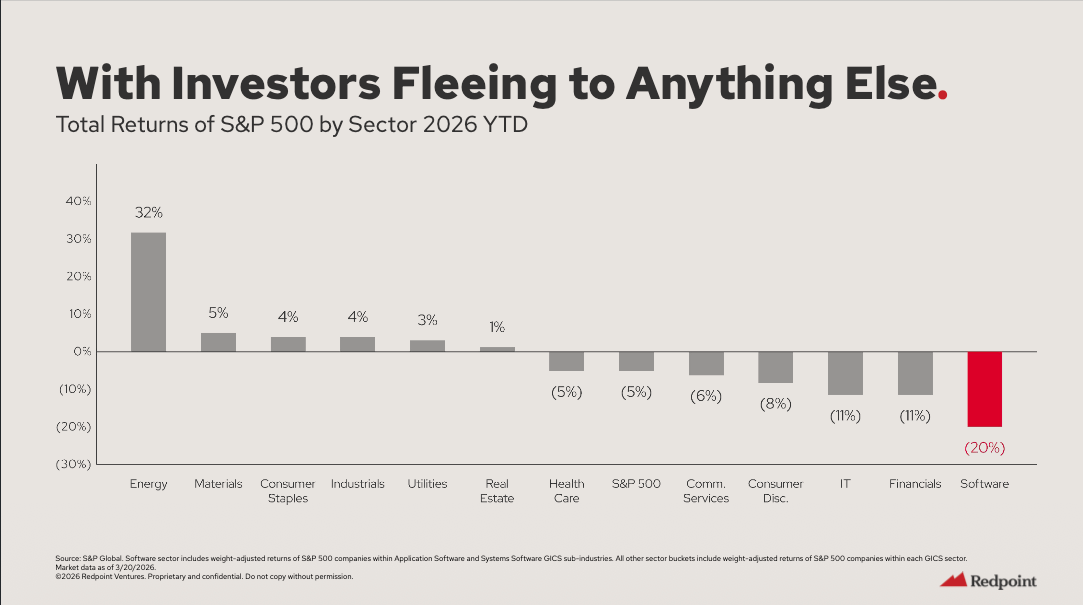
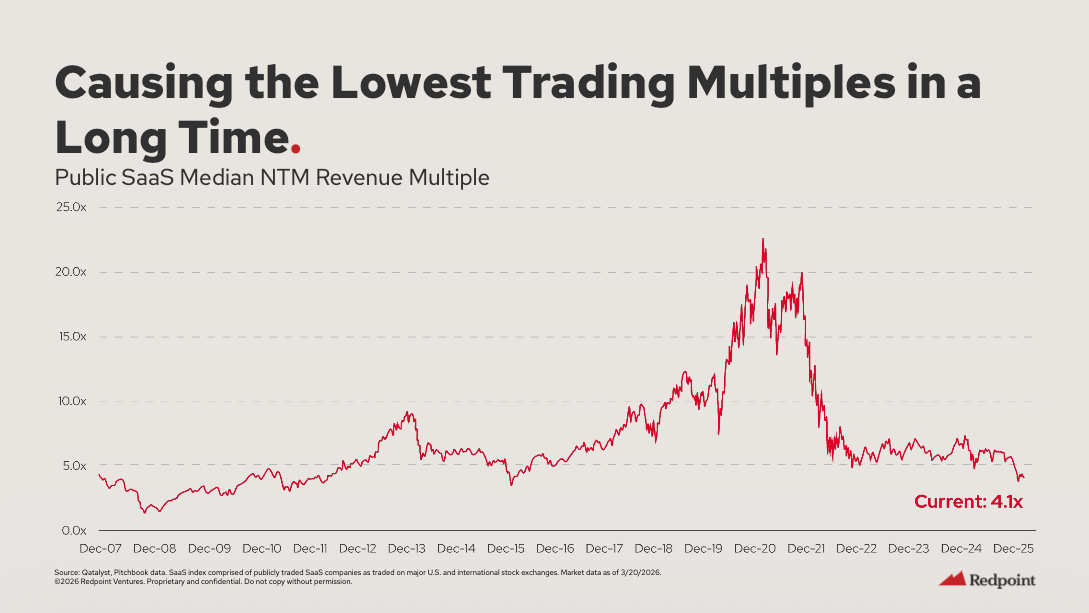
Software is down 20% YTD, the worst-performing sector in the S&P 500 (Slide 12). Public SaaS median NTM multiple is at 4.1x, the lowest since Redpoint started tracking in 2007 (Slide 13). But the selloff didn’t hit evenly. And the unevenness is where the real signal lives.
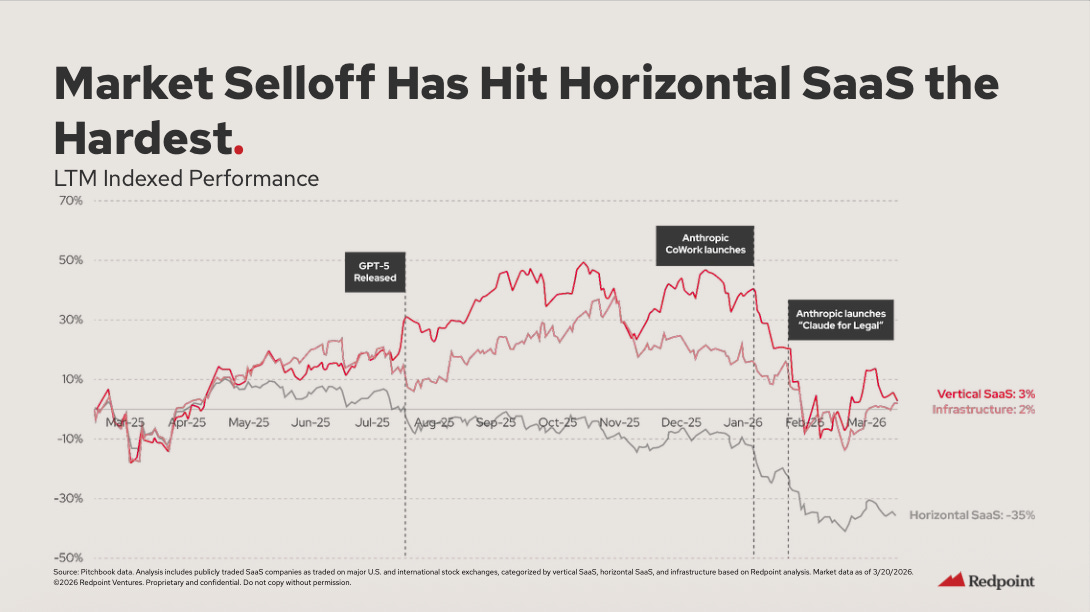
Redpoint breaks it into three layers (Slide 16-17):
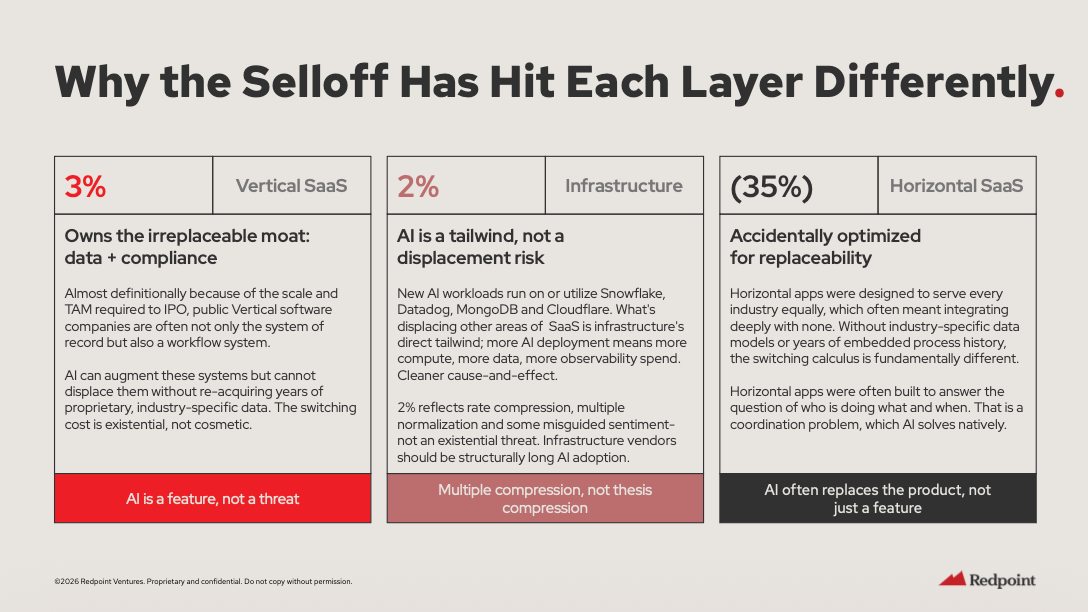
Vertical SaaS: +3% LTM. These companies own the irreplaceable moat: proprietary data plus compliance infrastructure. AI can’t displace Veeva in life sciences or Toast in restaurants without re-acquiring years of industry-specific data, regulatory relationships, and transaction embedding. For vertical SaaS, AI is a feature, not a threat.
Infrastructure: +2% LTM. More AI deployment means more compute, more data, more observability. Snowflake, Datadog, MongoDB, Cloudflare all get AI tailwinds. The multiple compressed, but the thesis didn’t.
Horizontal SaaS: -35% LTM. This is the kill zone. These companies, as Redpoint puts it, “accidentally optimized for replaceability.” They built to serve every industry equally, which meant integrating deeply with none. Their core value prop was answering “who is doing what and when,” which is a coordination problem. AI solves coordination natively.
That -35% isn’t panic. It’s the market correctly pricing the fact that horizontal SaaS moats were always an illusion. The switching cost was familiarity, not dependency. And familiarity is worthless when a new tool is 10x better on day one.
The Agent Maturity Curve Changes the Math
Here’s where the Redpoint deck gets genuinely important. Slide 7 maps the agent maturity curve:
Copilots (where we’ve been): TAM is ~$0.5T, the existing US software spend
Task Agents (where we are now): TAM grows to ~$1.2T, adding services automation
Workflow Agents (next 18-24 months): TAM hits ~$2.8T, adding operational payroll
Autonomous (the endgame): TAM reaches $6.1T+, unlocking knowledge worker payroll
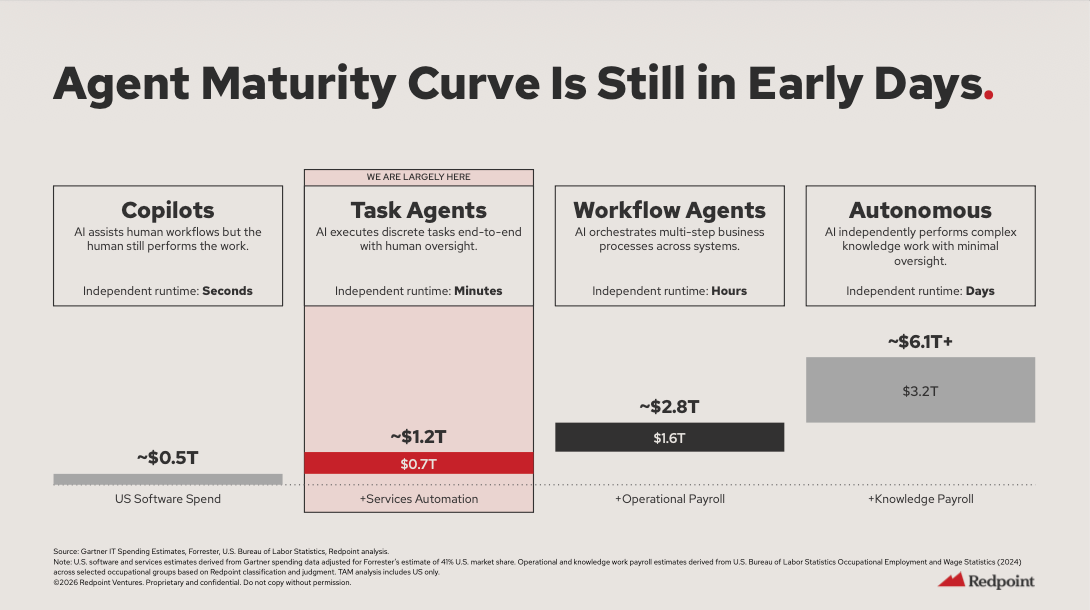
We’re at Task Agents. Minutes of independent runtime. Human oversight still required. But even at this stage, the TAM has already doubled beyond software. The companies winning here aren’t selling seats. They’re selling outcomes against labor budgets.
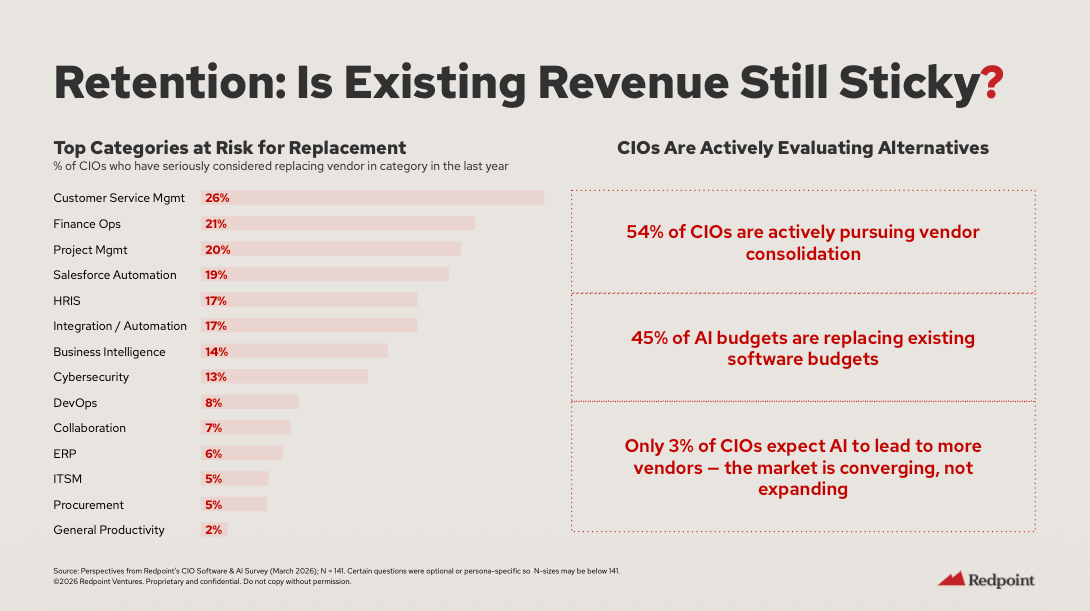
This is why 58% of CIOs say AI features are the #1 driver of software spend increases (Slide 19), and simultaneously, 54% are pursuing vendor consolidation and 45% of AI budgets are replacing existing software (Slide 20). Only 3% of CIOs expect AI to lead to more vendors. The market is converging, not expanding.
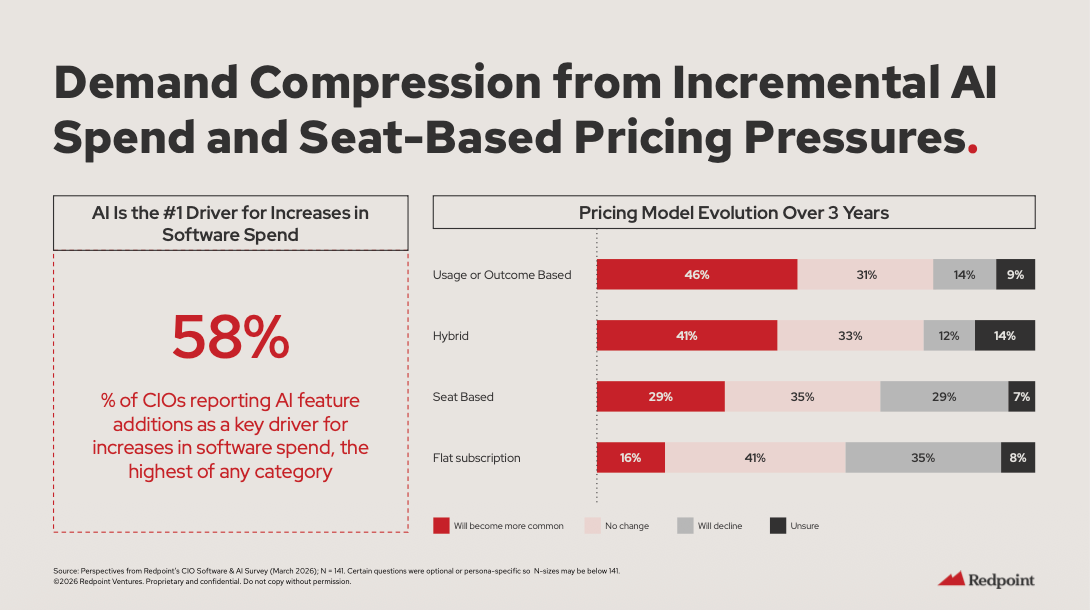
Read those numbers together. CIOs are spending more on software, but only when that software has AI capabilities baked in. And they want fewer vendors, not more. The pricing model is shifting underneath everything: 46% of CIOs expect usage or outcome-based pricing to become more common, while 35% expect flat subscriptions to decline. The per-seat model that built the SaaS industry is unwinding in real time.
AI spending is going up. Software vendor count is going down. Pricing is shifting from seats to outcomes. If you’re a horizontal SaaS company selling per-seat licenses for coordination software, those three facts are a death sentence unless you pivot fast.
The Newspaper Analogy (Why Quarterly Beats Don’t Matter)
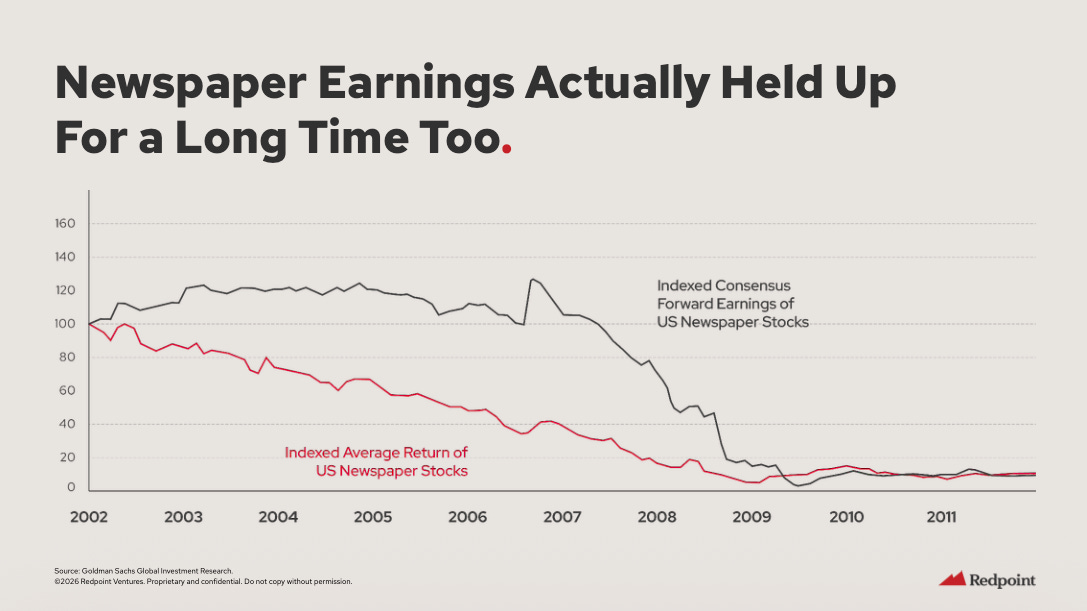
Redpoint draws a chilling parallel on Slide 22: US newspaper stock returns started collapsing around 2002, but consensus forward earnings held up until 2007 before falling off a cliff. Stock prices led earnings by roughly five years.
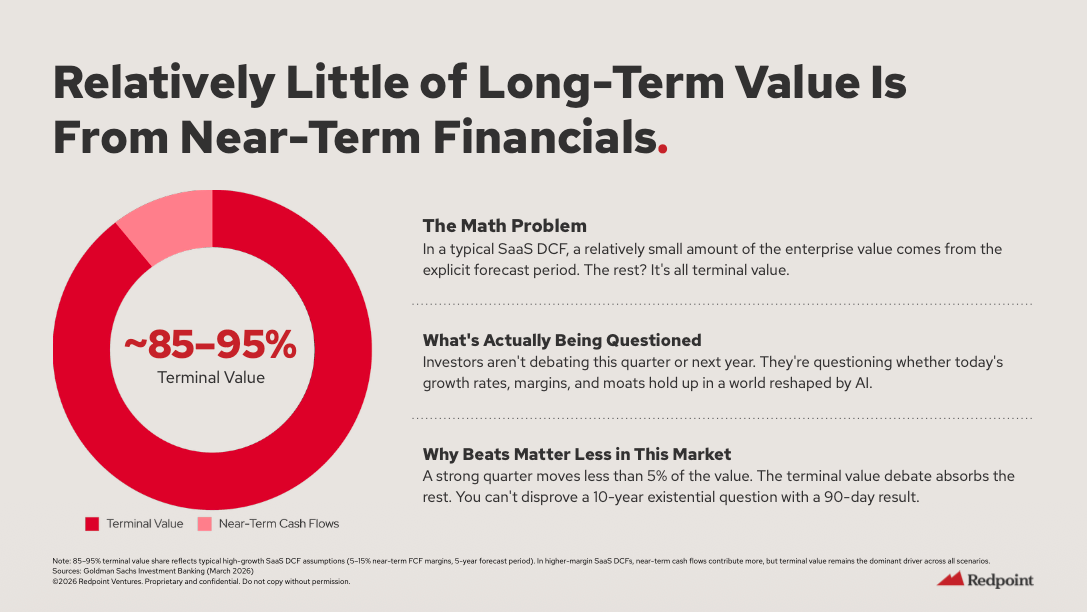
Apply that to SaaS. Companies are still posting decent quarters. Revenue is still growing. But 85-95% of SaaS enterprise value is terminal value, not explicit forecast period (Slide 23). A strong quarter moves less than 5% of the value. You can’t disprove a 10-year existential question with a 90-day result.
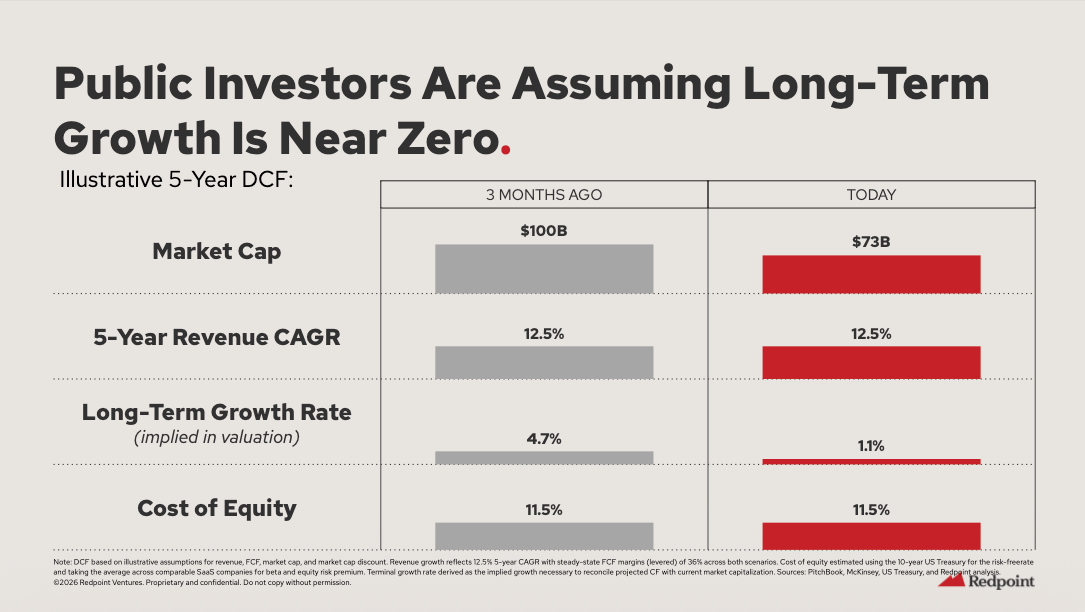
The market sees this. In three months, the implied long-term growth rate for a representative SaaS company collapsed from 4.7% to 1.1% (Slide 24). The near-term estimates didn’t change. The terminal value did. Public investors are telling you they believe SaaS growth asymptotes to near-zero over the long term.
Even if a company beat estimates, the stock can drop the next day. Now they know why.
Where the Vulnerability Is Highest
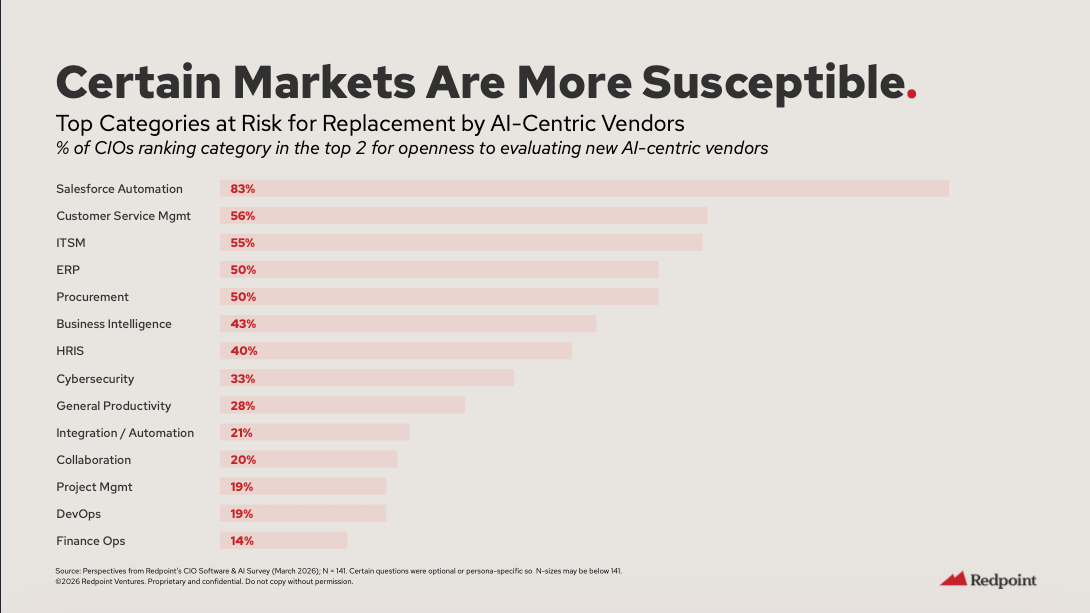
The CIO survey data on Slide 30 tells you exactly where to worry. When asked which categories they’re most open to replacing with AI-centric vendors:
Salesforce Automation: 83% (this should terrify Salesforce)
Customer Service: 56%
ITSM: 55%
ERP: 50%
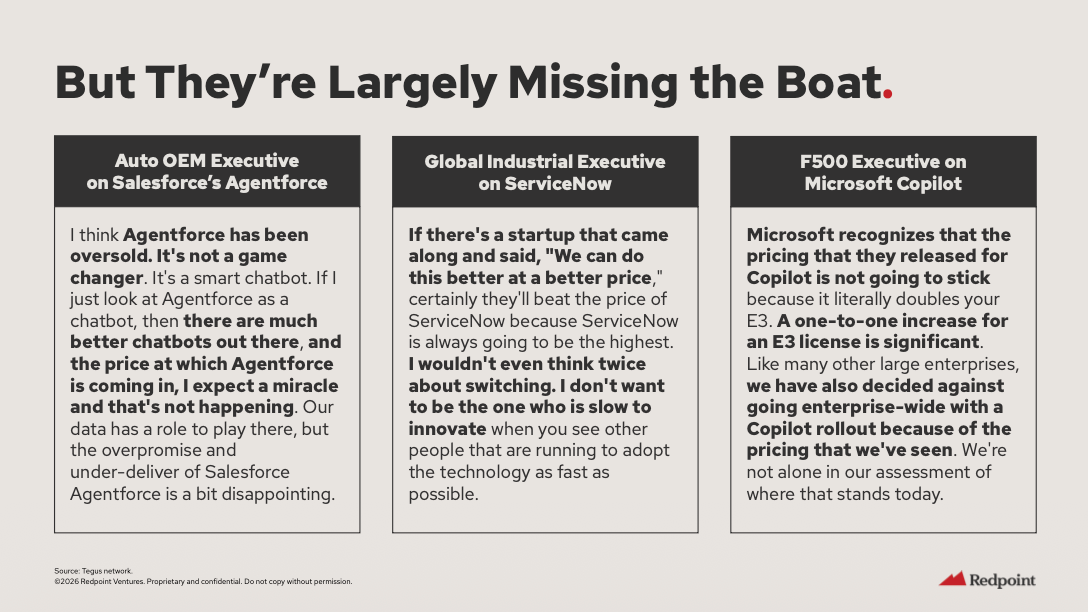
And the incumbents are, in Redpoint’s assessment, “missing the boat” (Slide 42). One auto OEM executive on Agentforce: “It’s been oversold. It’s not a game changer. It’s a smart chatbot.” A Fortune 500 executive on Microsoft Copilot: the pricing “literally doubles your E3” and they’ve decided against enterprise-wide rollout. A global industrial executive on ServiceNow: “If there’s a startup that came along and said, ‘We can do this better at a better price,’ I wouldn’t even think twice about switching.”
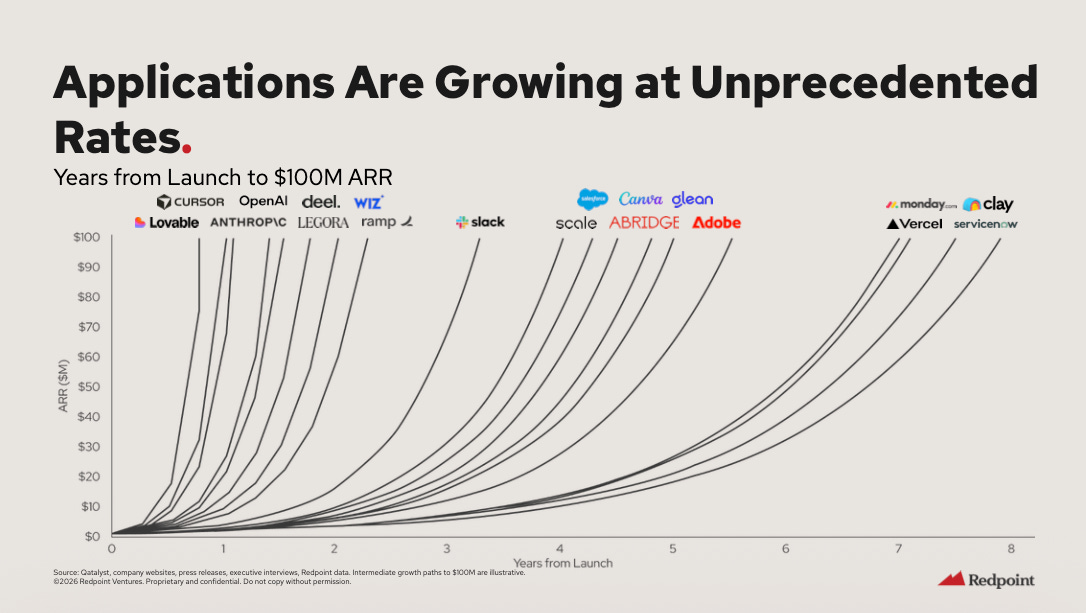
The AI-native companies are operating at a fundamentally different efficiency level. Cursor generates $6.1M in ARR per employee. Lovable: $3.4M. Compare that to the incumbents they’re disrupting: Salesforce sits at $0.54M. Atlassian: $0.46M (Slide 55). Cursor is producing 11x more revenue per human than Salesforce. That’s not a marginal improvement. That’s a structural cost advantage that compounds every quarter. It means AI-native companies can undercut incumbents on price, outspend them on R&D as a percentage of revenue, and still generate better margins.
As one commentator on the deck noted: the incumbents can’t decouple revenue from headcount. They sell seats. They staff with humans. Their entire economic model assumes that revenue scales linearly with people. AI-native companies broke that assumption on day one.
Three Questions to Ask Monday Morning
1. Are you vertical or horizontal? If you can’t name the specific regulatory framework, industry data set, or transaction type that makes your product irreplaceable in your market, you’re horizontal. Start the re-founding conversation (Redpoint’s term) now. Not next quarter.
2. Can your revenue decouple from headcount? The AI-powered P&L model Redpoint outlines (Revenue +25-35%, headcount costs -15-20% across every function) only works if you can deliver more value with fewer people. If your revenue model is fundamentally tied to the number of humans on your team or your customer’s team, you’re on the wrong side of the curve.
3. What happens at Workflow Agents? We’re at Task Agents today. The jump to Workflow Agents (hours of independent runtime, multi-step business processes across systems) is coming in the next 18-24 months. That jump takes the addressable market from $1.2T to $2.8T. But it also means AI goes from executing discrete tasks to orchestrating entire workflows. Every product that exists primarily as workflow orchestration software becomes a feature of the agent, not a platform the agent runs on.
The Window
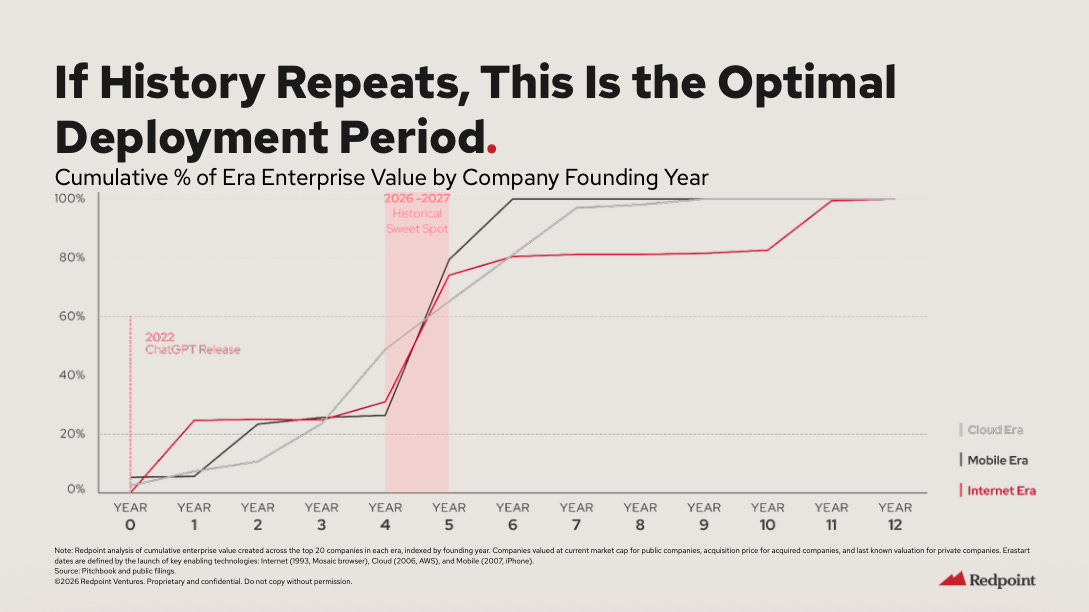
Slide 67 is the one I keep coming back to. Across three platform shifts (internet, cloud, mobile), the durable winners were founded in years 4-5 after the shift began. ChatGPT launched in November 2022. We’re in year 4. 2026-2027 is the window.
That’s not a VC pitch. That’s a pattern backed by three decades of data. The companies that will own the next era of business software are being built right now. Some of them are incumbents who execute a genuine architectural reset. Most of them are AI-native startups running at $3-6M ARR per employee while the incumbents are stuck at $500K.
The prescription starts with one honest question: when AI agents can orchestrate entire workflows, what part of your product is still irreplaceable?
If you can’t answer that clearly, the market already has.